Sign Up


Open it from the project menu: Health Dashboard. Four tabs — Lists, Insights, Monitoring, Checking.
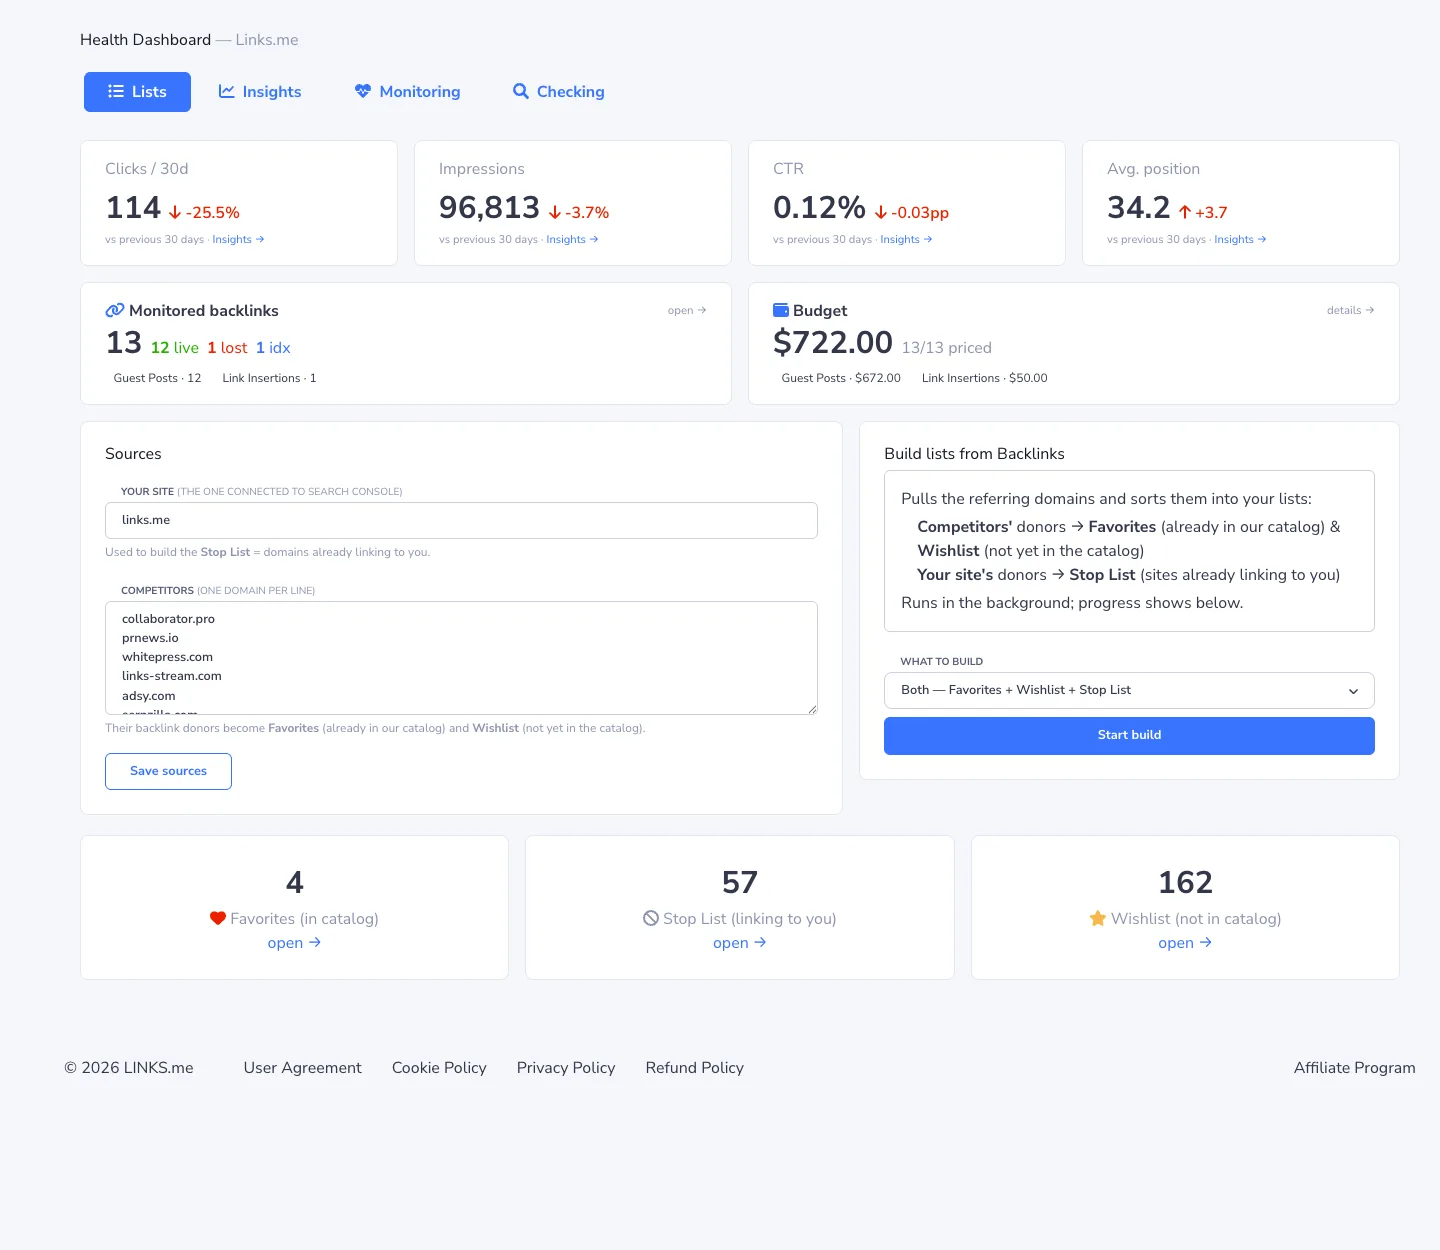
Lists — where to get links
This tab answers one question: "where do my competitors get their links, and what am I still missing?"
Enter your site and a list of competitors (up to 50 domains, one per line) and press Start build. The system pulls the competitors' referring domains and sorts them into three lists:
| List | What's in it | What to do with it |
|---|---|---|
| Favorites | Sites that link to your competitors and are already in the Links.me catalog | Open and order a placement in a couple of clicks |
| Wishlist | Sites that link to your competitors but aren't in the catalog yet | Nothing — as soon as a site joins the catalog it moves to Favorites automatically and you get an email |
| Stop List | Sites that already link to you | Excluded from results so you never pay for a link from a site you're already on |
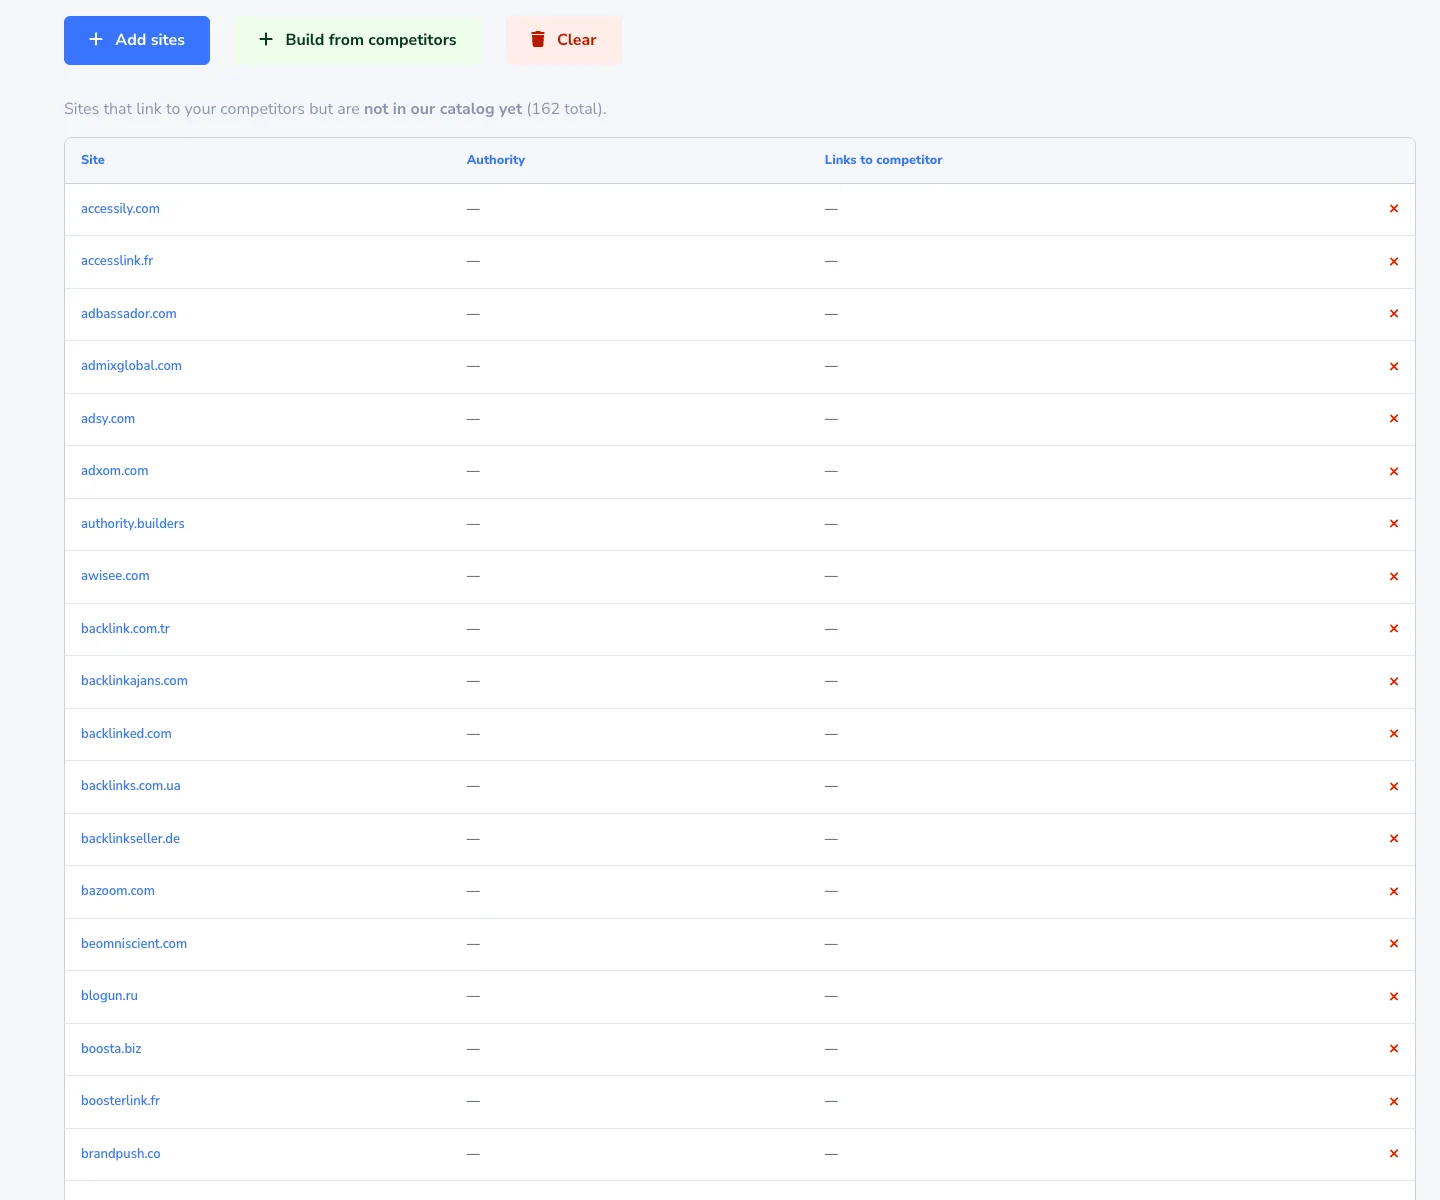
The build runs in the background; progress is shown right on the tab. It costs $0.006 per domain added, charged to the project balance. You only pay for what actually lands in the lists: a domain that was already in Favorites is never billed twice. If the balance doesn't cover every donor, the build adds as many as it can and tells you so.
At the top of the tab is a project summary: clicks and impressions from Search Console for the last 30 days, the number of monitored links split into live / lost / indexed, and the total placement budget.
Insights — what's happening to your traffic
Connect Google Search Console with one button (OAuth, nothing to copy) and the tab turns into an analytics report for your site.
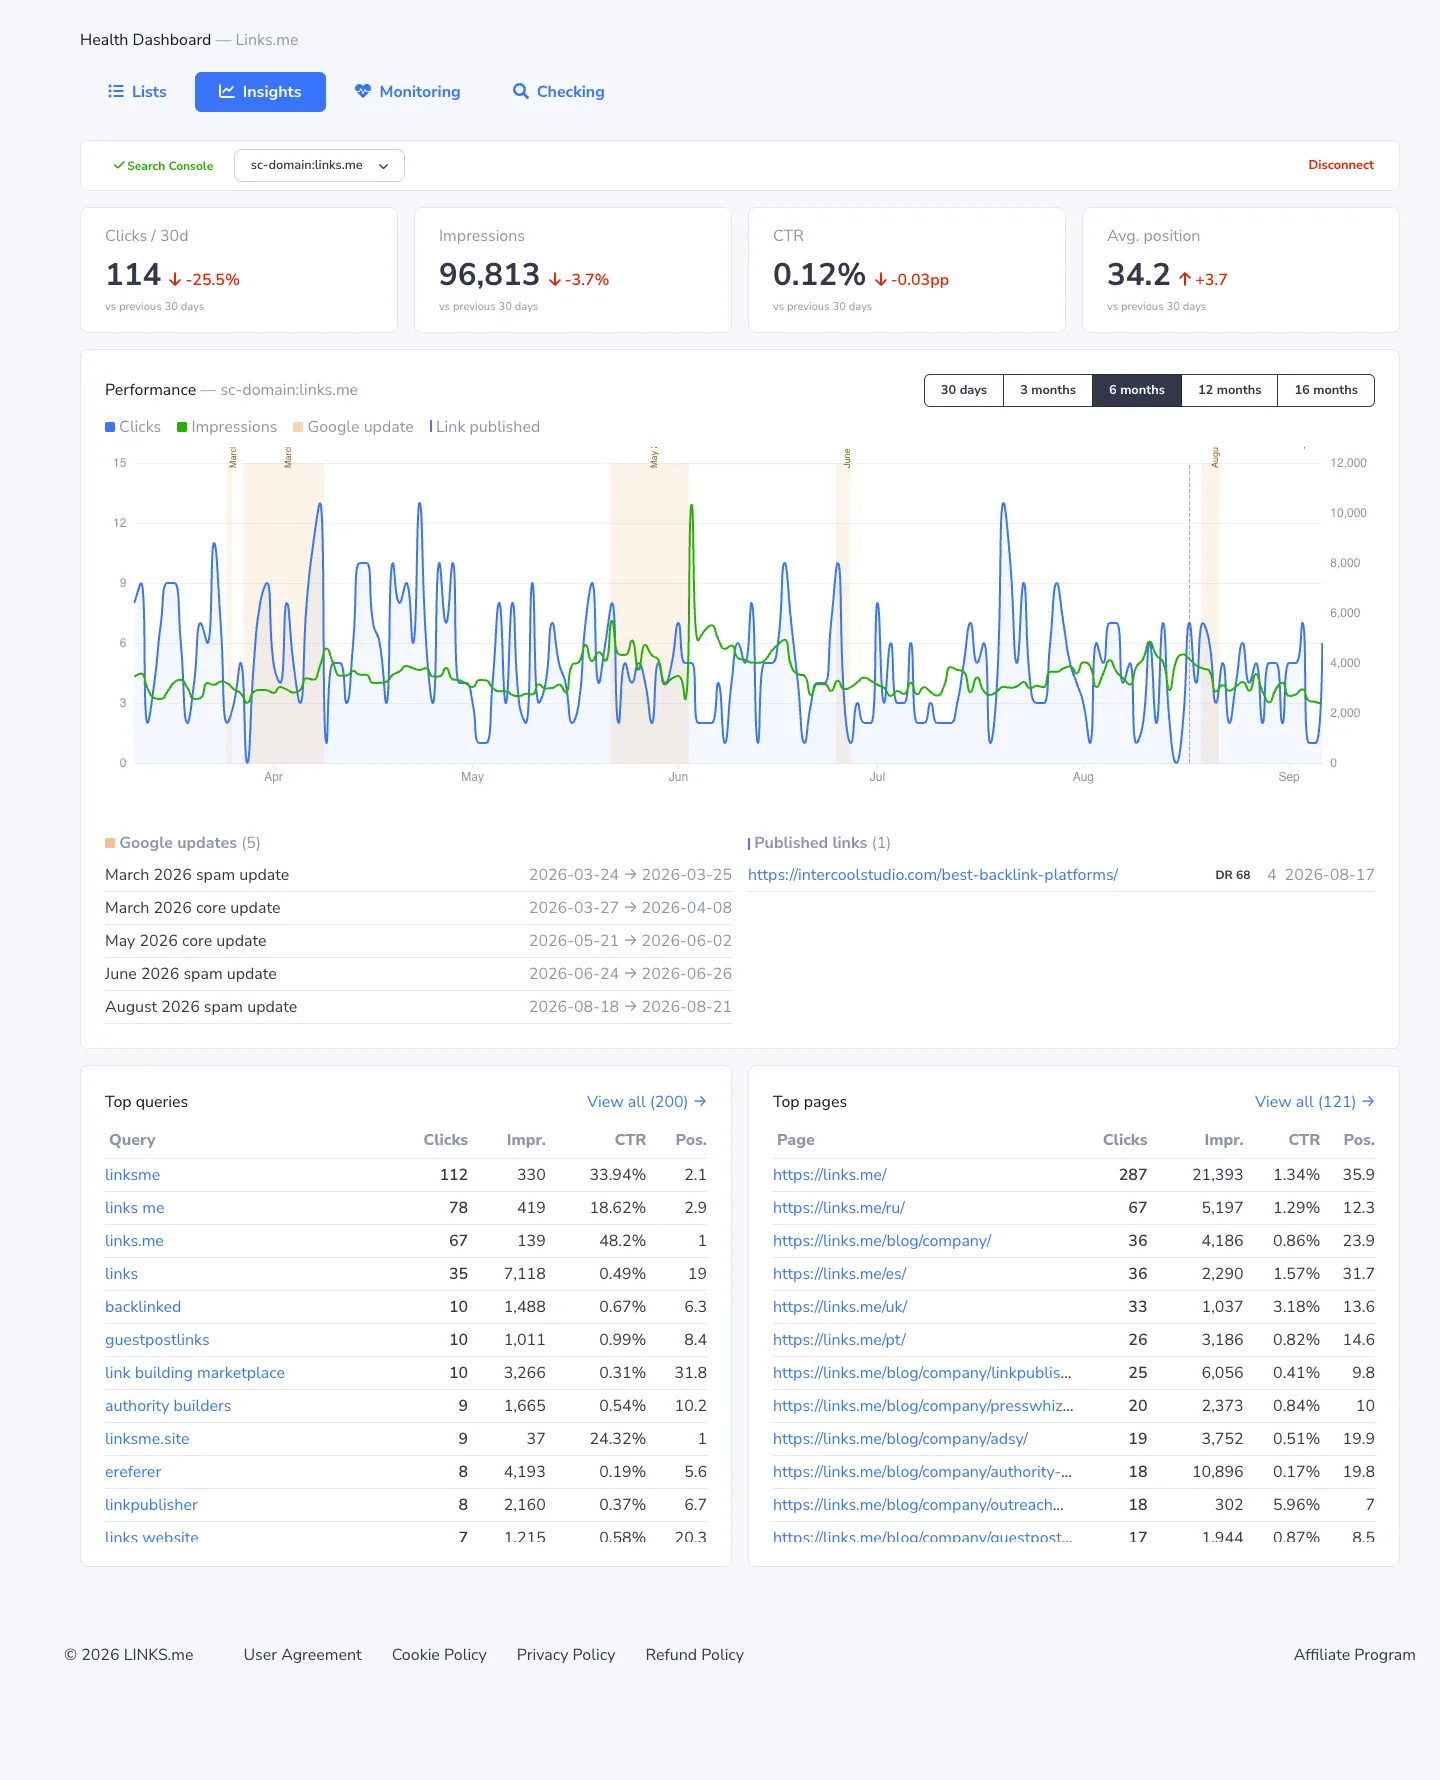
The centerpiece is a clicks and impressions chart covering up to 16 months, with two layers on top:
- orange bands — Google updates (spam, core) with start and end dates;
- purple markers — the dates your placements went live.
So you can see what actually moved traffic: the latest update, or the link you bought a week before the rise. Below the chart, the same events are listed with dates, so you don't have to guess from the picture.
Below that — top queries and top pages with clicks, impressions, CTR, and position. Each has a full page with a filter:
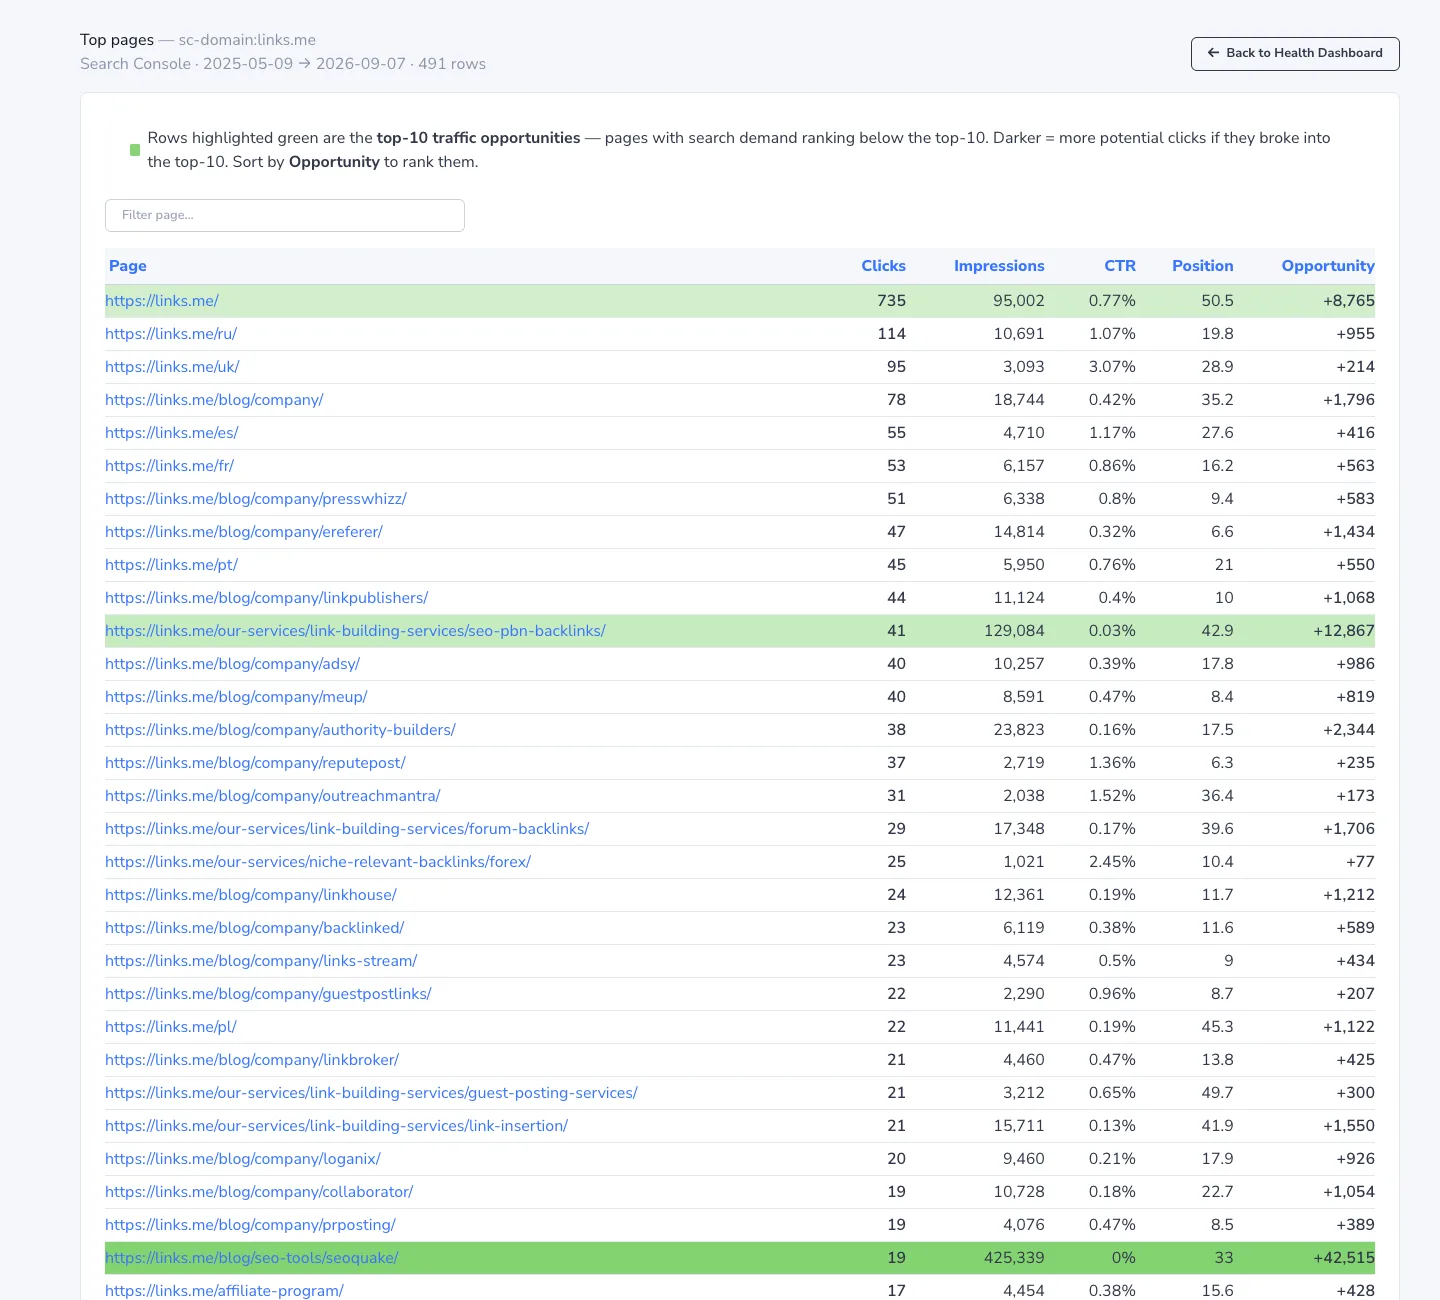
The green highlight marks opportunities: pages and queries with plenty of impressions but a position outside the top 10. The Opportunity column estimates how many clicks breaking into the top 10 would add. These are the pages to reinforce with links first — sorting by that column is a ready-made buying plan.
Clicking a page or query opens a drill-down: the queries for that page, the pages for that query, and a country breakdown — useful when a site serves several markets.
Monitoring — are your links alive
The central tab. All of your backlinks in one table, each one checked regularly.
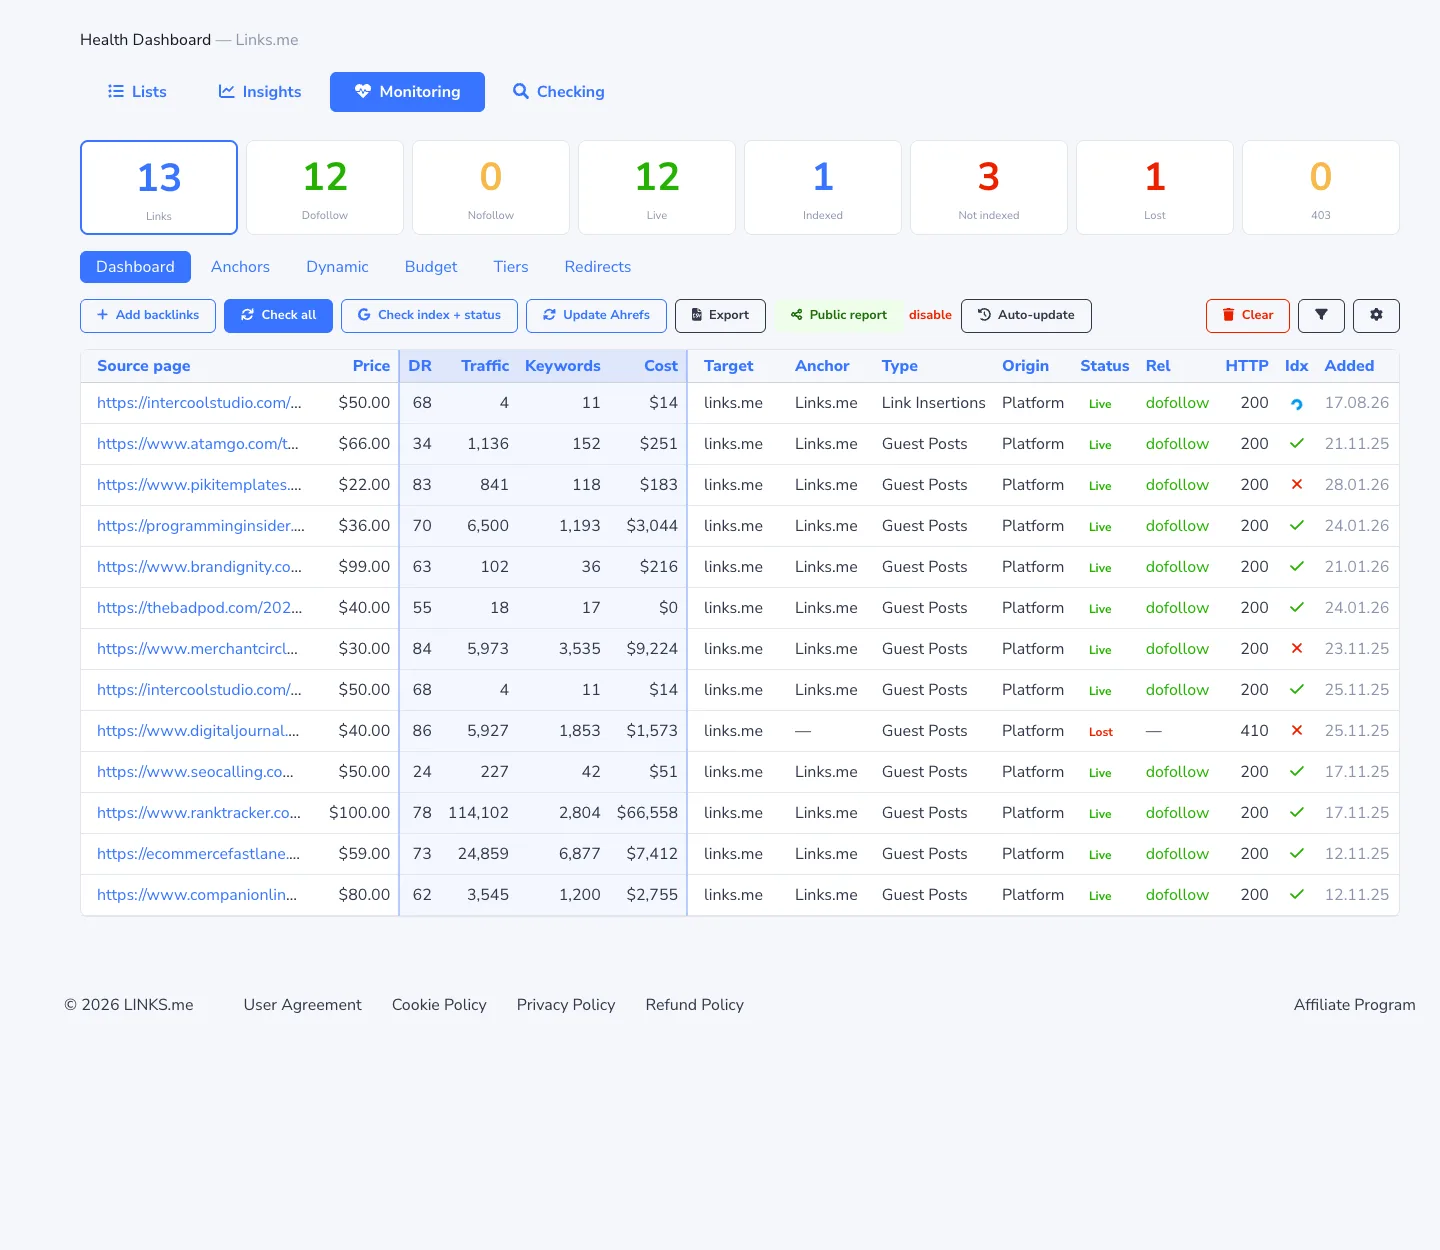
How links get here. Everything you buy on Links.me is added automatically, with the real publication date and price. Links placed elsewhere are pasted in via Add backlinks — one per line, optionally with the anchor.
What's known about each link. Price, DR, traffic, keyword count, and traffic value of the donor (Ahrefs); target page; anchor; type (Guest Post / Link Insertion); origin; Live / Lost status; dofollow / nofollow; HTTP code; and Google indexation.
Action buttons:
| Button | What it does | Cost |
|---|---|---|
| Check all | Verifies the link is still there, the anchor hasn't changed, and the dofollow attribute is intact | free |
| Check index + status | Same, plus whether each page is indexed in Google | $0.006 per page |
| Update Ahrefs | Refreshes donor DR, traffic, keywords, and traffic value | $0.04 per site |
| Export | Downloads the table as CSV with every column | free |
| Auto-update | A schedule for automatic checks: daily, weekly, or monthly — set separately for status and for Ahrefs | rates above |
Paid checks are charged to the project balance, and only for what was actually checked: if the external service rejects some pages, you aren't billed for them.
Below the table — five analytical views:
- Anchors — anchor distribution, so the profile doesn't look over-optimized;
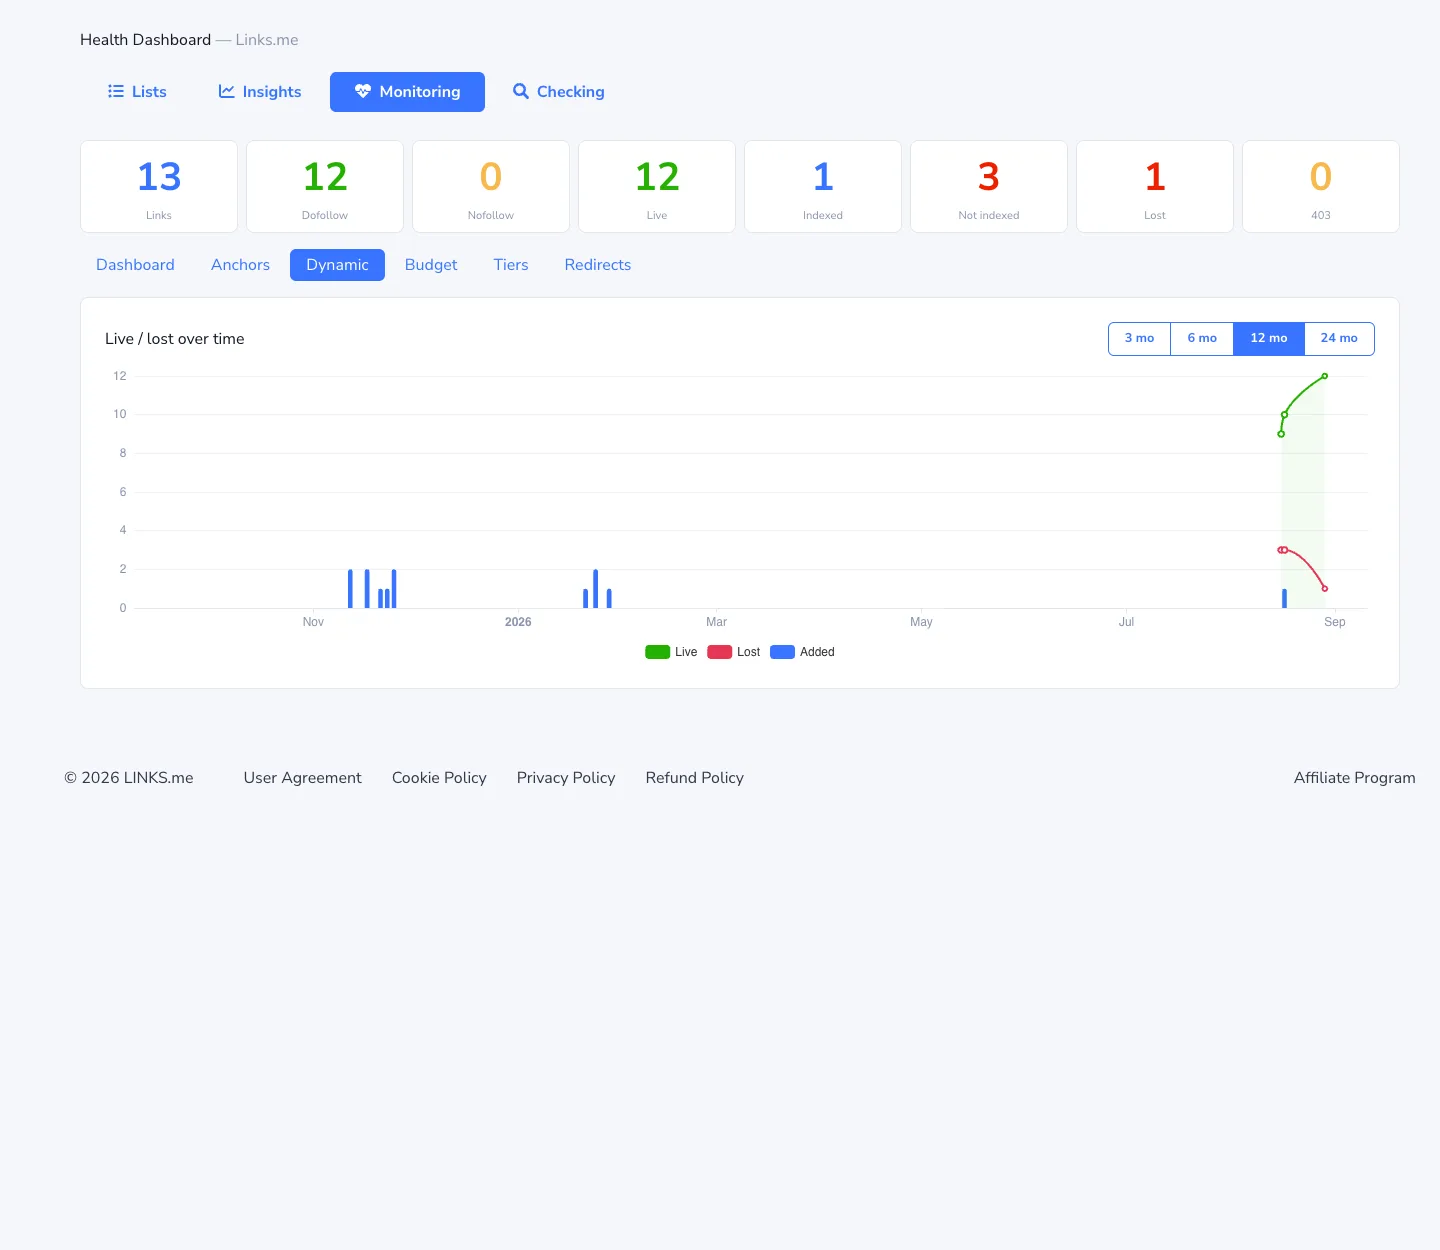
- Dynamic — a live / lost / added chart by month;
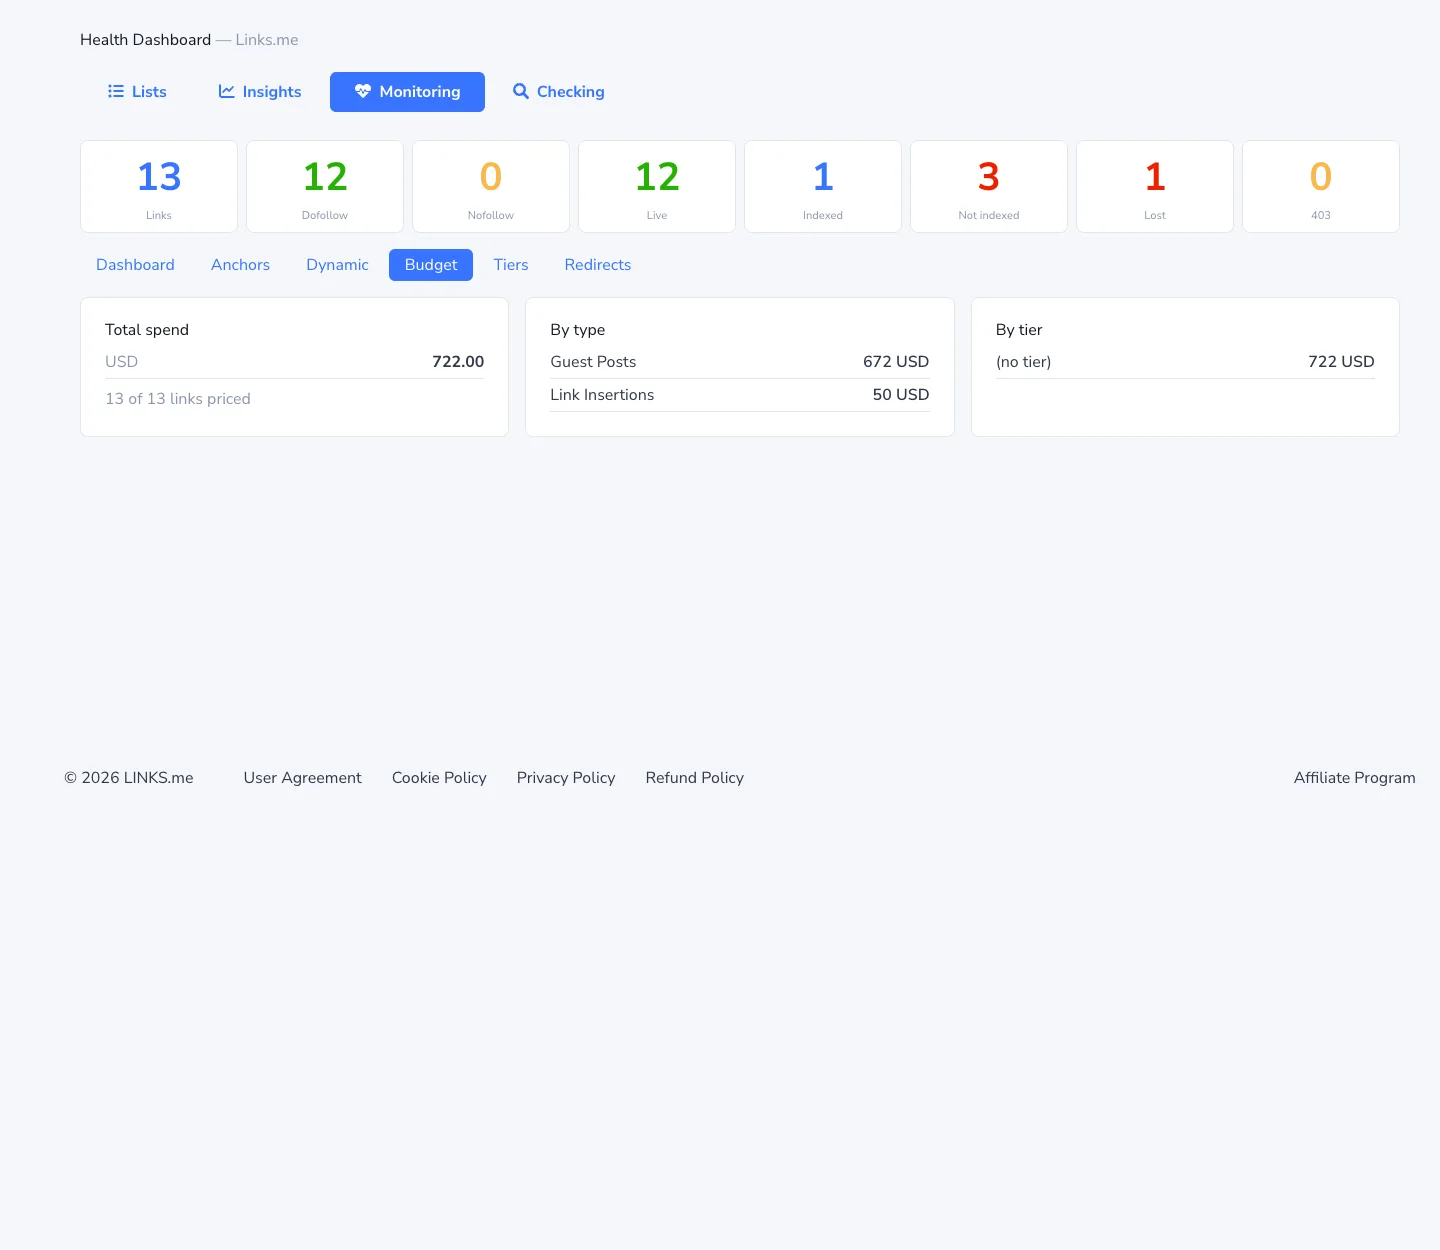
- Budget — how much was spent, broken down by placement type and by tier;
- Tiers — which links are tier 1, 2, and 3;
- Redirects — if you've moved between domains, list the old addresses and links to them count as live.
A public report for your client
If you're an agency or a freelancer, the Public report button creates a link you can send to a client. It opens without a login and shows the state of the links, donor metrics, and the trend chart.
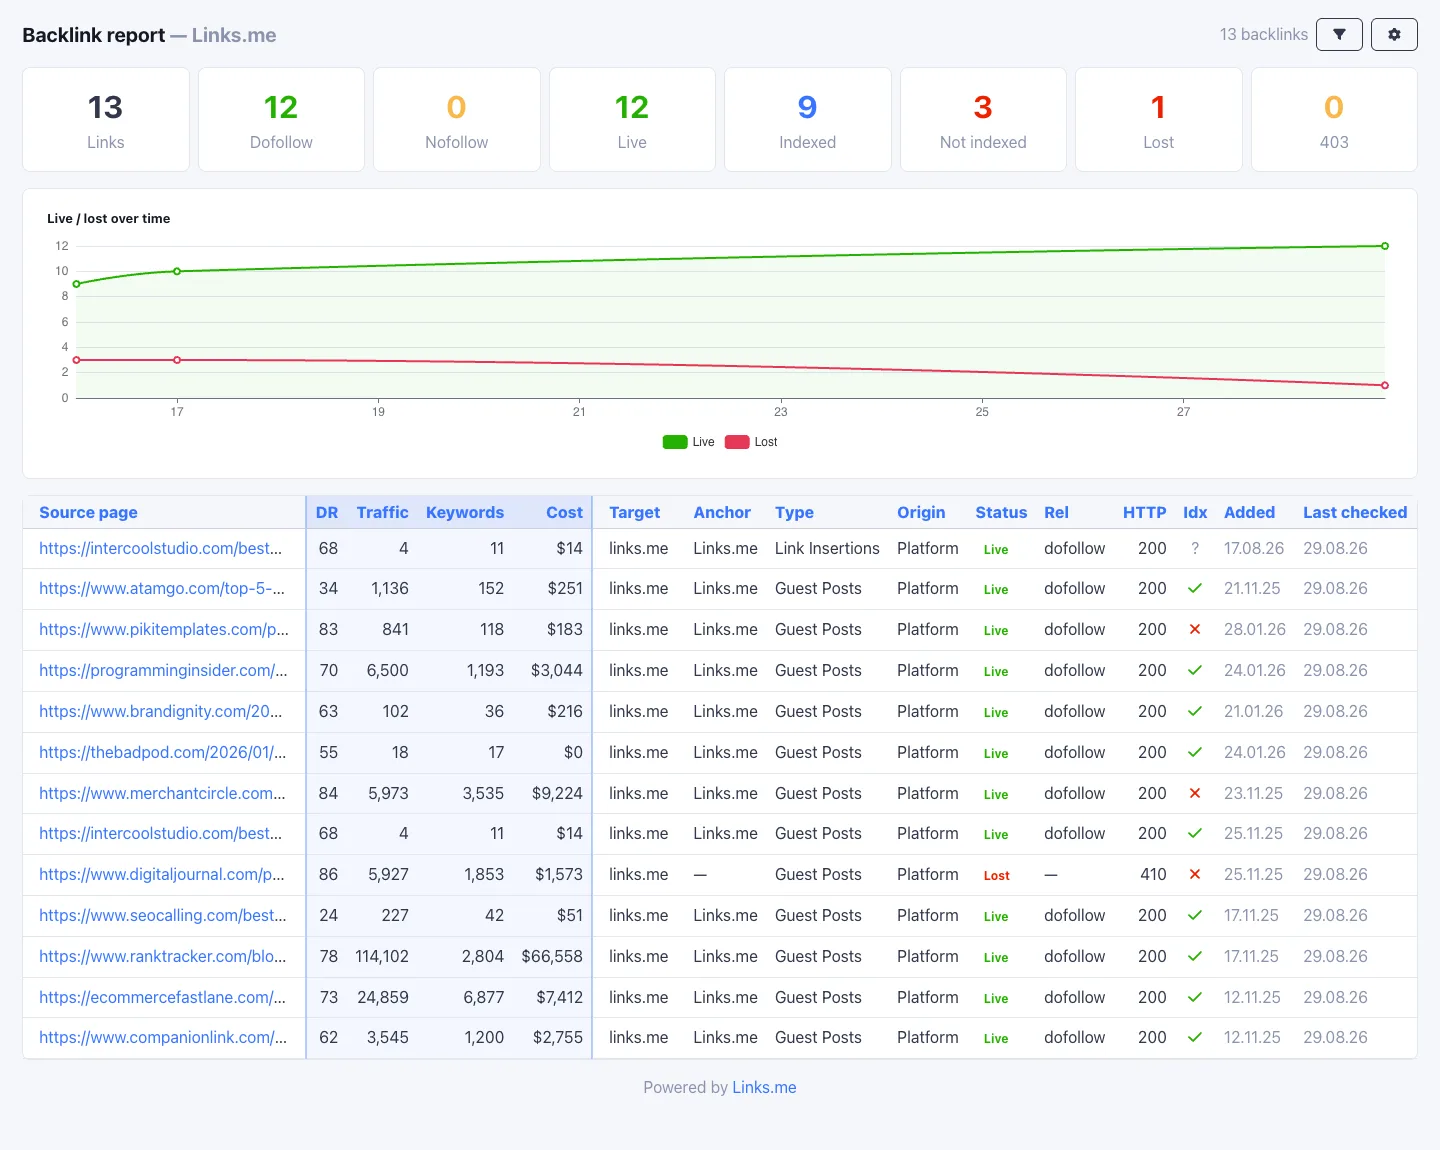
The report carries client-facing data only: donor page, metrics, status, date. Your purchase prices, internal notes, and tags are not in it — not on screen and not in the page source. The link can be revoked at any time with the same button.
Checking — verify any list of links
A tab for one-off jobs: a contractor sent a report with 300 links and you need to know which of them actually exist.
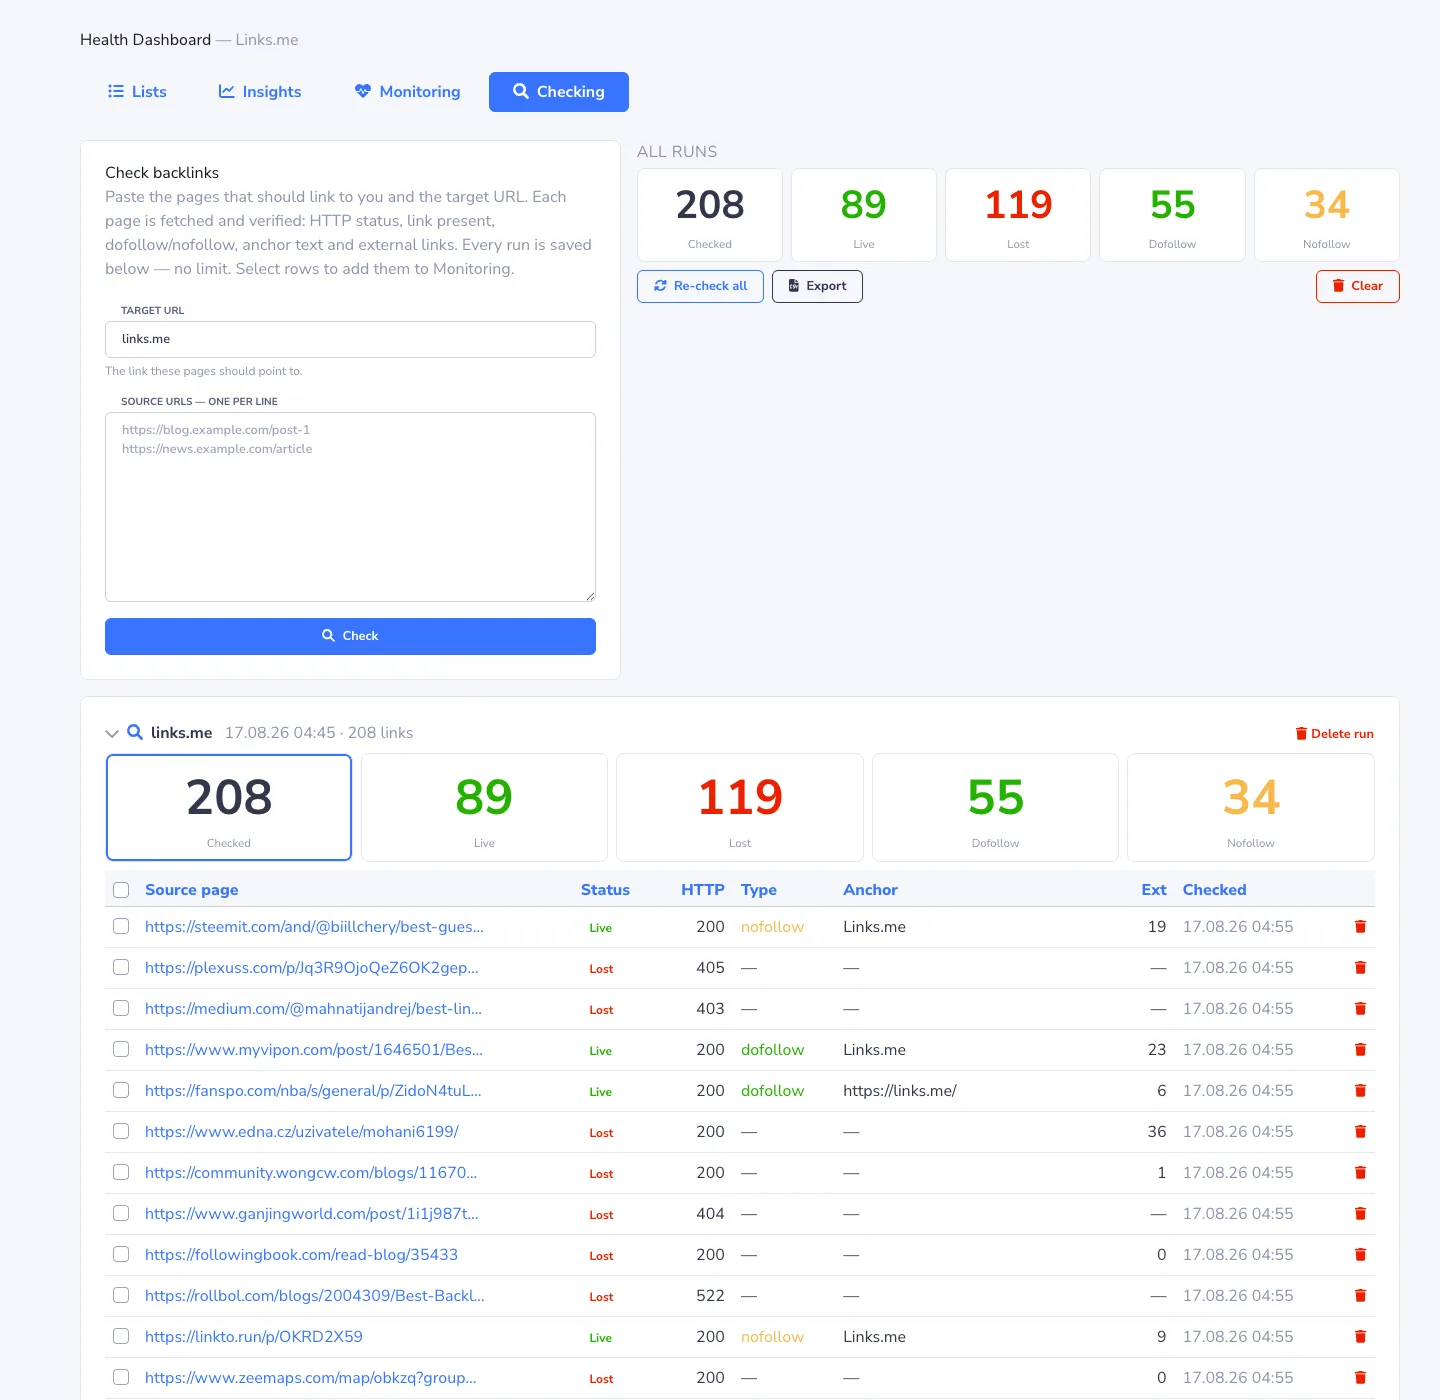
Paste a list of pages (up to 5,000 per run) and the target URL. For each page it checks: does it respond, is the link present, is it dofollow or nofollow, what's the anchor, how many external links are on the page. The result is a Checked / Live / Lost / Dofollow / Nofollow summary plus a detailed table.
Every run is saved separately, so you can come back and compare. Tick the rows and one button adds them to Monitoring with the status already filled in. Checking is free, with no limit on the number of runs.
Getting started
- Open a project → Health Dashboard.
- On Lists, enter your site and competitors and press Start build.
- On Insights, connect Search Console.
- On Monitoring, your purchases are already there; add external links via Add backlinks and switch on Auto-update.
- If you manage clients, create a Public report and send them the link.
Every paid operation is charged to the project balance you already top up for purchases. Nothing extra to set up.
Everything the dashboard does by hand is also available through the API — covered in .the API article.
 ChatGPT
 Perplexity
 Claude
 Google AI Mode
 Grok
Grok